Tidyuesday
library(tidytuesdayR)
library(tidyverse)
library(ggridges)
library(ggsci)
library(gganimate)
library(ggforce)
tt <- tt_load('2020-02-11')
save(tt, file = "tt.Rdata")
load("tt.Rdata")
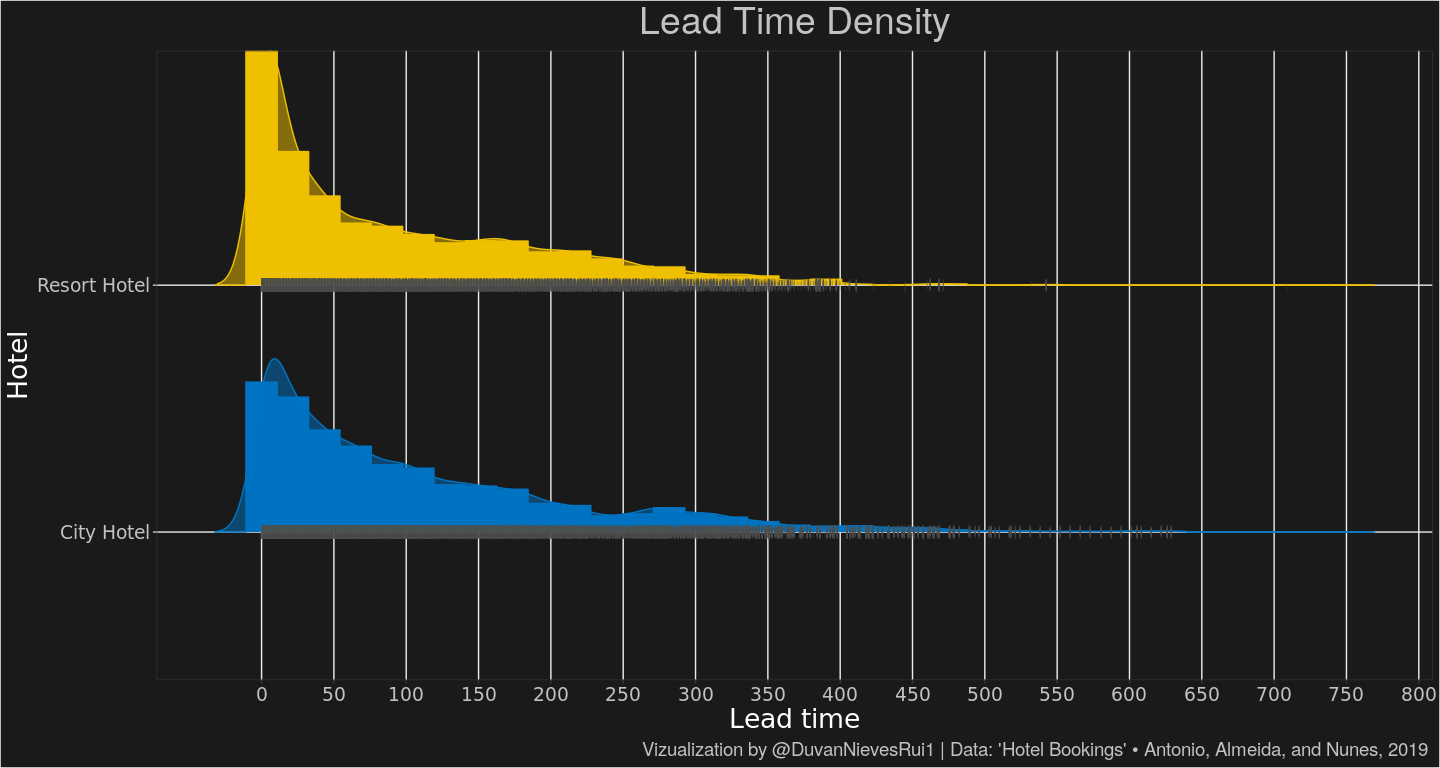
hotels <- tt$hotels
hotels %>%
  select(hotel,lead_time) %>%
  ggplot(., aes(x=lead_time, fill=hotel, y=hotel, color =hotel))+
  geom_density_ridges(aes(height = stat(density)),stat = "binline", bins = 35, scale = 0.95, draw_baseline = T) +
  geom_density_ridges(jittered_points=T,alpha=.5, scale=.95,point_alpha=.4,
                      point_shape="|",point_size=2, point_color ="grey30",
                      position = position_points_jitter(height = -0.01))+
  scale_fill_jco()+ scale_color_jco()+ scale_x_continuous(breaks = seq(0,800,50))+
  labs(title = "Lead Time Density",
       x = "Lead time",
       y = "Hotel",
       caption = "Vizualization by @DuvanNievesRui1 | Data: 'Hotel Bookings' • Antonio, Almeida, and Nunes, 2019")+
  theme_bw()+
  theme(panel.grid.minor = element_blank(),
        axis.ticks.y = element_line(color = "grey76"),
        legend.position = "none",
        legend.background =  element_blank(),
        legend.key.size = unit(1.5,"cm"),
        panel.background = element_rect(fill="grey10",color = "grey10"),
        plot.background = element_rect(fill="grey10"),
        panel.spacing.y = unit(0, "cm"),
        plot.title = element_text(size=28, color="grey76",hjust = .5),
        plot.subtitle  = element_text(size=20, color="grey76", hjust = .5),
        plot.caption = element_text(size = 14,color = "grey76", hjust = .99),
        axis.text = element_text(family = "Roboto Mono",
                                 size = 14,
                                 colour = "grey76"),
        strip.text.y =element_text(family = "Roboto Mono",
                                   size = 14, angle = 180,
                                   colour = "grey76"),
        axis.title =  element_text(family = "Roboto Mono",
                                   size = 20,
                                   colour = "white"),
        legend.text = element_text(family = "Roboto Mono",
                                   size = 10,
                                   colour = "grey76"),
        legend.title = element_text(family = "Roboto Mono",
                              size = 14,
                              colour = "grey76"))
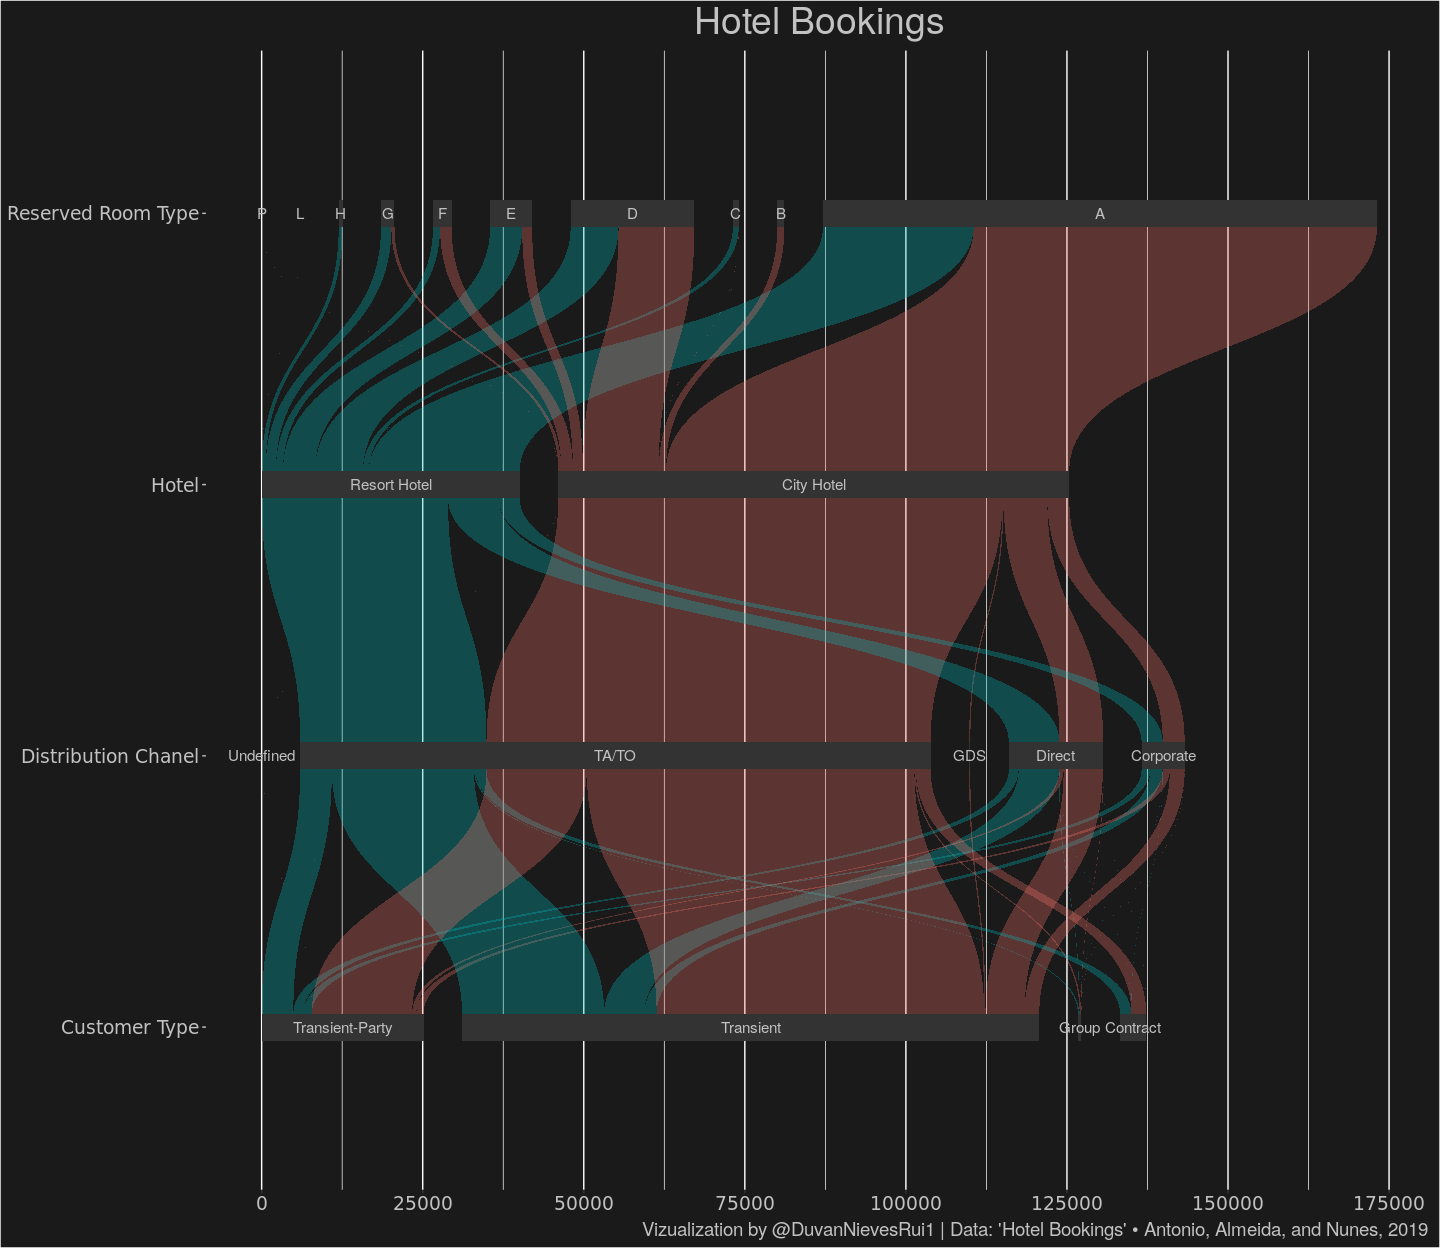
hotels %>%
  select(hotel, distribution_channel,reserved_room_type,customer_type) %>%
  group_by(hotel, distribution_channel,reserved_room_type,customer_type) %>%
  summarise(value = n()) %>%
  gather_set_data(x = 1:4) %>%
  ggplot(., aes(x, id = id, split = y, value = value)) +
  geom_parallel_sets(aes(fill = hotel), alpha = 0.3, axis.width = 0.1)+
  geom_parallel_sets_axes(axis.width = 0.1) +
  geom_parallel_sets_labels(colour = 'grey76', angle = 360, size=4) +
  scale_y_continuous(breaks = seq(-25000,200000,25000))+
  scale_x_discrete(labels=c('reserved_room_type'='Reserved Room Type','hotel'='Hotel','distribution_channel'='Distribution Chanel','customer_type' ='Customer Type'))+
  coord_flip()+
  labs(title = "Hotel Bookings",
       caption = "Vizualization by @DuvanNievesRui1 | Data: 'Hotel Bookings' • Antonio, Almeida, and Nunes, 2019")+
  theme(panel.grid.major.y = element_blank(),
        axis.ticks.y = element_line(color = "grey76"),
        legend.position = "none",
        legend.key.size = unit(1.5,"cm"),
        panel.background = element_rect(fill="grey10",color = "grey10"),
        plot.background = element_rect(fill="grey10"),
        plot.title = element_text(size=28, color="grey76",hjust = .5),
        plot.subtitle  = element_text(size=20, color="grey76", hjust = .5),
        plot.caption = element_text(size = 14,color = "grey76", hjust = .99),
        axis.title.x = element_blank(),
        axis.title.y = element_blank(),
        axis.text = element_text(family = "Roboto Mono",
                                 size = 14,
                                 colour = "grey76"),
        strip.text.y =element_text(family = "Roboto Mono",
                                   size = 14, angle = 180,
                                   colour = "grey76"),
        axis.title =  element_text(family = "Roboto Mono",
                                   size = 20,
                                   colour = "white"),
        legend.text = element_text(family = "Roboto Mono",
                                   size = 10,
                                   colour = "grey76"),
        legend.title = element_text(family = "Roboto Mono",
                              size = 14,
                              colour = "grey76"))