load("spotify_songs.Rdata")
df <- spotify_songs %>%
select(-c(1,5,8:11,13:25)) %>%
distinct() %>%
group_by(track_name, track_artist,track_album_name,track_album_release_date) %>%
summarise(track_popularity= max(track_popularity),danceability = max(danceability)) %>%
separate(track_album_release_date,c("year")) %>%
mutate(year=as.numeric(year)) %>%
mutate(decade = case_when( between(year,1950,1960) == TRUE ~"The 50s",
between(year,1960,1970) == TRUE ~"The 60s",
between(year,1970,1980) == TRUE ~"The 70s",
between(year,1980,1990) == TRUE ~"The 80s",
between(year,1990,2000) == TRUE ~"The 90s",
between(year,2000,2010) == TRUE ~"The 00s",
between(year,2010,2020) == TRUE ~"The 10s"))
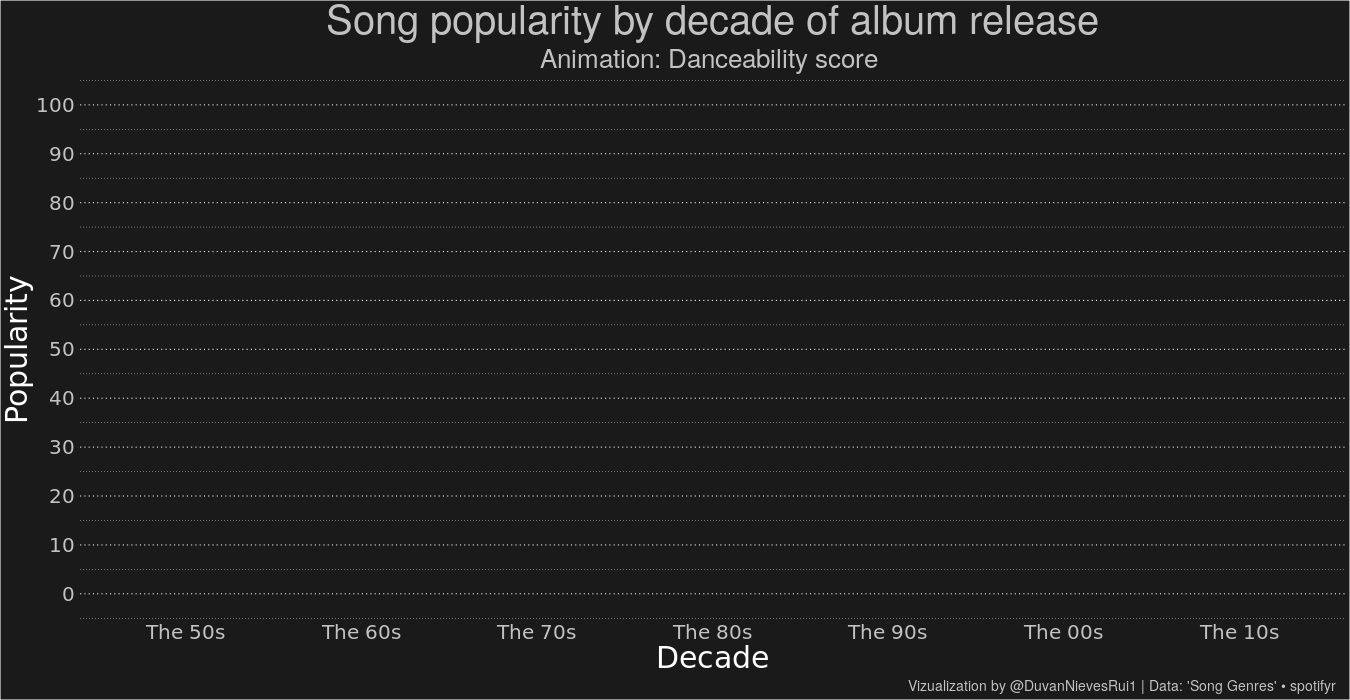
g <- ggplot(df,aes(x=reorder(decade,year), y=track_popularity , alpha=track_popularity, color=track_popularity)) +
geom_jitter(size=2)+
scale_y_continuous(breaks = seq(0,100,10))+
scale_color_gradient2(low = "limegreen",high = "red4", mid = "gold", midpoint = 50) +
guides(color=FALSE,alpha=FALSE,fill=FALSE,shape=FALSE) +
labs(caption = "Vizualization by @DuvanNievesRui1 | Data: 'Song Genres' • spotifyr",
title = "Song popularity by decade of album release",
subtitle = "Animation: Danceability score ",
y="Popularity",
x="Decade") +
geom_label(aes(x=4,y=97, label="Danceability >= 0.90"),fill="grey20",size=6, color="grey76")+
geom_jitter(data = df %>% filter(danceability >= 0.90),shape="\U1F483", size=5)+
geom_label(aes(x=4,y=97, label="Danceability >= 0.80"),fill="grey20",size=6, color="grey76")+
geom_jitter(data = df %>% filter(danceability >= 0.80),shape="\U1F57A",size=5)+
geom_label(aes(x=4,y=97, label="Danceability >= 0.70"),fill="grey20",size=6, color="grey76")+
geom_jitter(data = df %>% filter(danceability >= 0.70),shape="\U1F483",size=5)+
geom_label(aes(x=4,y=97, label="Danceability >= 0.60"),fill="grey20",size=6, color="grey76")+
geom_jitter(data = df %>% filter(danceability >= 0.60),shape="\U1F57A",size=5)+
geom_label(aes(x=4,y=97, label="Danceability >= 0.50"),fill="grey20",size=6, color="grey76")+
geom_jitter(data = df %>% filter(danceability >= 0.50),shape="\U1F483",size=5)+
theme(legend.position = "none",
panel.grid.major.x = element_blank(),
line = element_line(linetype = "dotted"),
panel.grid.minor.x = element_blank(),
panel.background = element_rect(fill="grey10",color = "grey10"),
plot.background = element_rect(fill="grey10"),
plot.title = element_text(size=40, color="grey76",hjust = .5),
plot.subtitle = element_text(size=26, color="grey76",hjust = .5),
plot.caption = element_text(size = 14,color = "grey76", hjust = .99),
axis.text = element_text(family = "Roboto Mono",
size = 20,
colour = "grey76"),
strip.text.x =element_text(family = "Roboto Mono",
size = 14,
colour = "grey76"),
axis.title = element_text(family = "Roboto Mono",
size = 30,
colour = "white"),
legend.text = element_text(family = "Roboto Mono",
size = 12,
colour = "grey76"),
legend.title = element_text(family = "Roboto Mono",
size = 16,
colour = "grey76"))+
transition_layers(layer_length = 4,
transition_length = 1,
keep_layers = c ( Inf , 1,0,1,0,1,0,1,0,1,0 )) +
enter_fade () + enter_grow () +
exit_fade () + exit_shrink ()
animate(g, renderer = gifski_renderer(),height = 700, width =1350,fps = 10)